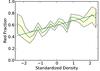
Fig. 9
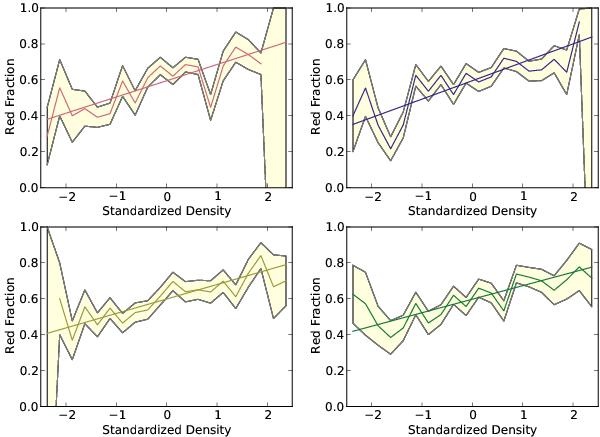
Fraction of red galaxies as a function of standardized density. In reading order: MBE, DEDICA, DTFE, kNN. The data is binned in 20 bins of width 0.25σ centered around the mean. The yellow region denotes the error in the calculated red fraction as determined from the Monte Carlo simulation. In all cases, a clear color-density relation can be seen. The MBE shows a clear dip in high density regions. DEDICA has such a dip in low density regions.
Current usage metrics show cumulative count of Article Views (full-text article views including HTML views, PDF and ePub downloads, according to the available data) and Abstracts Views on Vision4Press platform.
Data correspond to usage on the plateform after 2015. The current usage metrics is available 48-96 hours after online publication and is updated daily on week days.
Initial download of the metrics may take a while.