Fig. 7
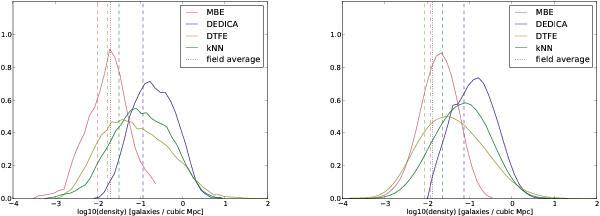
The normalized distribution of the density values in log-space for each estimator. The distributions are smooth and close to Gaussian. The average field densities as calculated with Eq. (19) are plotted as dashed lines. A broader range in densities (DTFE, kNN) denotes that the estimator detects more clustering. More clustering results in more galaxies in higher density regions, shifting the peak of the distribution to the right. The dotted line represents the measured average field density from the selection function (see text). Left: “cone” sample. Right: “shell” sample.
Current usage metrics show cumulative count of Article Views (full-text article views including HTML views, PDF and ePub downloads, according to the available data) and Abstracts Views on Vision4Press platform.
Data correspond to usage on the plateform after 2015. The current usage metrics is available 48-96 hours after online publication and is updated daily on week days.
Initial download of the metrics may take a while.