Free Access
Fig. 6
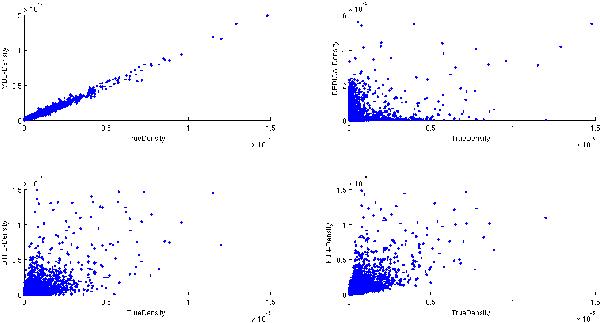
Plot of true versus estimated field densities of the MSG-MBE dataset by MBE (top left), DEDICA (top right), DTFE (bottom left) and kNN (bottom right). Approximately 16 000 random grid locations are shown.
Current usage metrics show cumulative count of Article Views (full-text article views including HTML views, PDF and ePub downloads, according to the available data) and Abstracts Views on Vision4Press platform.
Data correspond to usage on the plateform after 2015. The current usage metrics is available 48-96 hours after online publication and is updated daily on week days.
Initial download of the metrics may take a while.