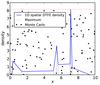
Fig. B.1
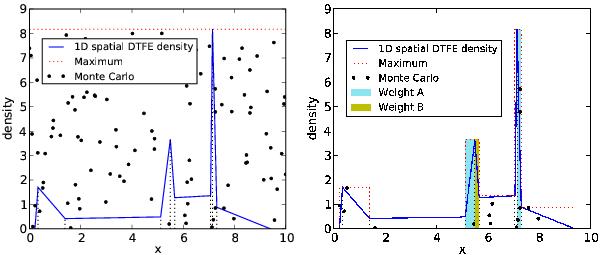
The original (left) and modified (right) Monte Carlo process for a 1 dimensional sample. The vertices on the blue line are the original sample points, the blue line itself the DTFE field. Black points are uniformly drawn in the area below the red line, those below the blue line are included in the new sample. In this 1D example, the lowering of the red line gives a factor 6 improvement in performance, in our MSG dataset this is more than a factor 10 000. The weights are given by the colored areas: the cyan cells have the same weight. The yellow cell has the same maximum density or volume as one of the cyan cells but a lower weight. (Densities are linear spatial densities, not probability densities).
Current usage metrics show cumulative count of Article Views (full-text article views including HTML views, PDF and ePub downloads, according to the available data) and Abstracts Views on Vision4Press platform.
Data correspond to usage on the plateform after 2015. The current usage metrics is available 48-96 hours after online publication and is updated daily on week days.
Initial download of the metrics may take a while.