Fig. A.1
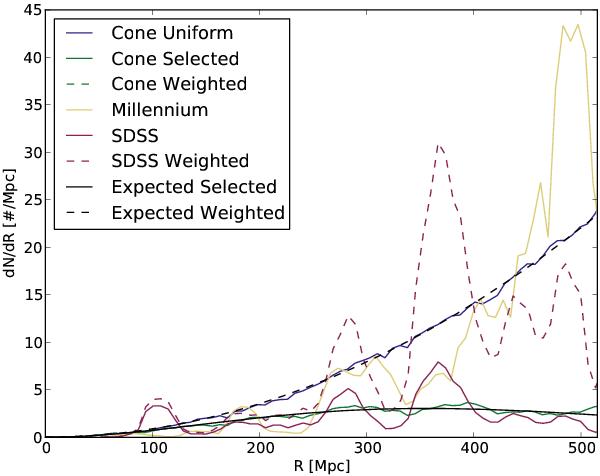
Radial distribution of the mock samples. The dashed black line shows the expected distribution of the galaxies, the black solid line after applying a luminosity selection. The (red) distribution of the “cone” sample shows more structure than a uniform mock would have (green), due to internal clustering.
Current usage metrics show cumulative count of Article Views (full-text article views including HTML views, PDF and ePub downloads, according to the available data) and Abstracts Views on Vision4Press platform.
Data correspond to usage on the plateform after 2015. The current usage metrics is available 48-96 hours after online publication and is updated daily on week days.
Initial download of the metrics may take a while.