Fig. 10
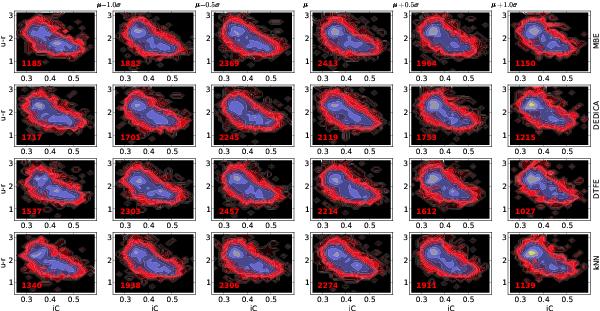
Normalized contour plots in color-concentration space for six bins in standardized density, for the SDSS “shell” sample and for each of the four density estimators. The subfigures are cropped to the same color and concentration range as Baldry et al. (2006). To aid comparison, every subfigure uses the same color levels. The red number in the lower left corner shows the number of galaxies in the bin.
Current usage metrics show cumulative count of Article Views (full-text article views including HTML views, PDF and ePub downloads, according to the available data) and Abstracts Views on Vision4Press platform.
Data correspond to usage on the plateform after 2015. The current usage metrics is available 48-96 hours after online publication and is updated daily on week days.
Initial download of the metrics may take a while.