Fig. 6
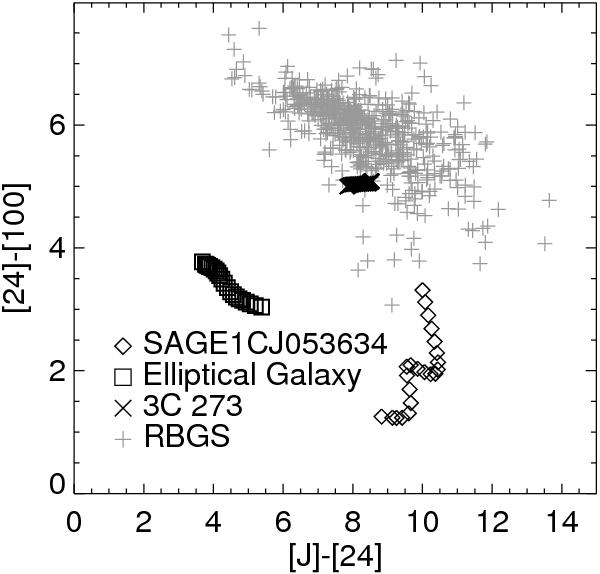
2MASS [J] – MIPS [24] vs. MIPS [24] – PACS [100] colour–colour diagram based on detections off the main part of the LMC (grey dots). The black diamonds show the simulated colours of a source like SAGE1CJ053634 as a function of redshift. We also show for the location of an elliptical galaxy and a more typical strong AGN source (3C 273) in this diagram. The redshift increases from 0 to 2 from left to right in the diagram for each source. The crosses show the approximate location of bright galaxies, using IRAS photometry based on the IRAS Revised Bright Galaxy Sample (RGBS, Sanders et al. 2003).
Current usage metrics show cumulative count of Article Views (full-text article views including HTML views, PDF and ePub downloads, according to the available data) and Abstracts Views on Vision4Press platform.
Data correspond to usage on the plateform after 2015. The current usage metrics is available 48-96 hours after online publication and is updated daily on week days.
Initial download of the metrics may take a while.