Fig. 5
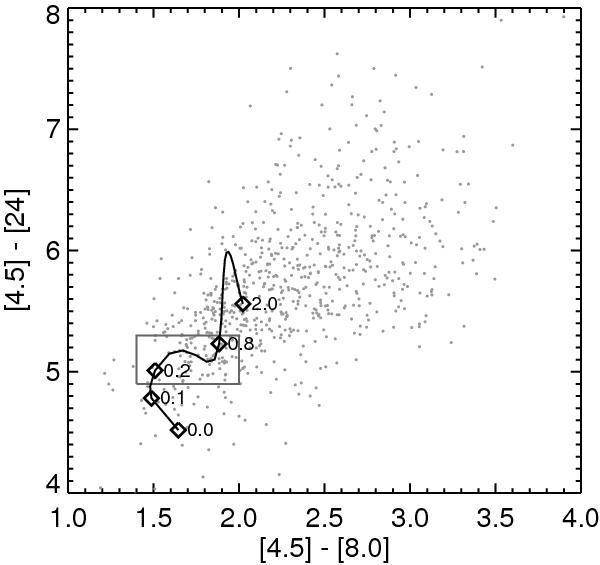
[8.0]–[4.5] vs. [24]–[4.5] colour–colour diagram based on detections off the main part of the LMC (grey dots). The grey box encompasses the region in which sources with similar magnitudes and colours as SAGE1CJ053634 are located. The black line shows the simulated colours of a source like SAGE1CJ053634 as a function of redshift.
Current usage metrics show cumulative count of Article Views (full-text article views including HTML views, PDF and ePub downloads, according to the available data) and Abstracts Views on Vision4Press platform.
Data correspond to usage on the plateform after 2015. The current usage metrics is available 48-96 hours after online publication and is updated daily on week days.
Initial download of the metrics may take a while.