Fig. 4
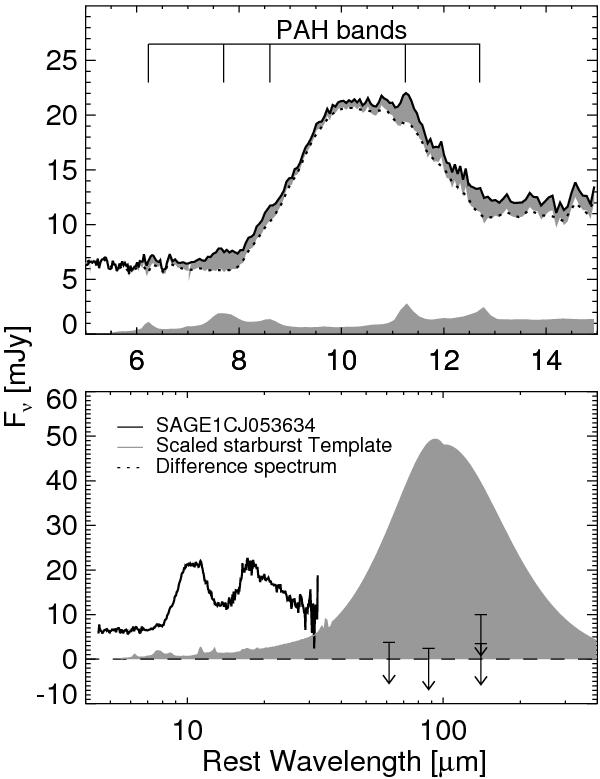
Decomposition of the mid-IR spectrum. The top panel shows the observed SAGE1CJ053634 spectrum in black. It is dominated by the silicate Si-O stretching feature. The position of the PAH features are indicated with tick-marks. The grey filled curves shows the spectrum of a starburst galaxy template from Mullaney et al. (2011) scaled to the intensity of the PAH bands. We show this template twice, once alone (bottom) and once perched on top of the silicate 10 μm feature. The bottom panel shows the full IR SED of SAGE1CJ053634, including the far-IR photometric 3σ upper limits, compared to the scaled template. The starburst template clearly over-predicts the far-IR flux levels.
Current usage metrics show cumulative count of Article Views (full-text article views including HTML views, PDF and ePub downloads, according to the available data) and Abstracts Views on Vision4Press platform.
Data correspond to usage on the plateform after 2015. The current usage metrics is available 48-96 hours after online publication and is updated daily on week days.
Initial download of the metrics may take a while.