Fig. 3
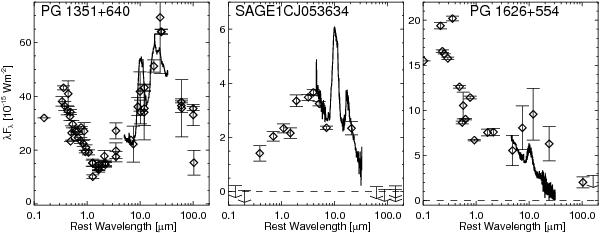
Comparison between SAGE1CJ053634 and the sources that exhibit the previously known extremes in either the 10 μm feature strength, (PG 1351+640; Hao et al. 2005) or the decline towards the far-IR, (PG 1626+554; Netzer et al. 2007). Both PG 1351+640 and PG 1626+554 are peculiar sources, that are far from being proto-typical. The diamonds indicate photometric measurements with their 1σ error-bars and arrows indicate the 3σ upper limits. The drawn lines show the IRS spectrum exhibiting the silicate emission features of each source. SAGE1CJ053634 stands out by the fact that most of its emission falls in the mid-IR range.
Current usage metrics show cumulative count of Article Views (full-text article views including HTML views, PDF and ePub downloads, according to the available data) and Abstracts Views on Vision4Press platform.
Data correspond to usage on the plateform after 2015. The current usage metrics is available 48-96 hours after online publication and is updated daily on week days.
Initial download of the metrics may take a while.