Fig. 2
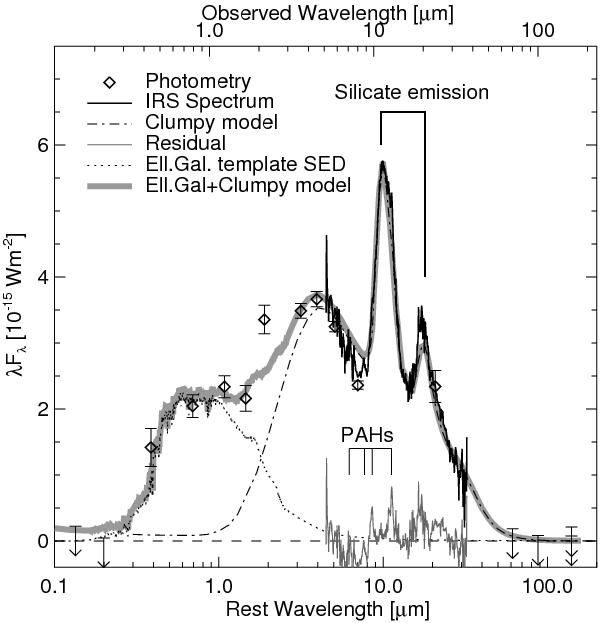
Energy distribution of SAGE1CJ053634. The diamonds indicate photometric measurements with their 1σ error-bars. The arrows indicate the 3σ upper limits. The predominance of warm silicate emission and the lack of cooler material in SAGE1CJ053634 is evident. The dot-dashed line shows the best fitting clumpy torus model (Nenkova et al. 2008). The clumpy torus model reproduces the strength and band ratio of the silicate emission well. PAH emission can be identified, see also the residual (solid grey). The grey dotted line shows the possible contribution from an elliptical host galaxy. The thick grey line shows the sum of the clumpy torus model and host galaxy emission.
Current usage metrics show cumulative count of Article Views (full-text article views including HTML views, PDF and ePub downloads, according to the available data) and Abstracts Views on Vision4Press platform.
Data correspond to usage on the plateform after 2015. The current usage metrics is available 48-96 hours after online publication and is updated daily on week days.
Initial download of the metrics may take a while.