Fig. 1
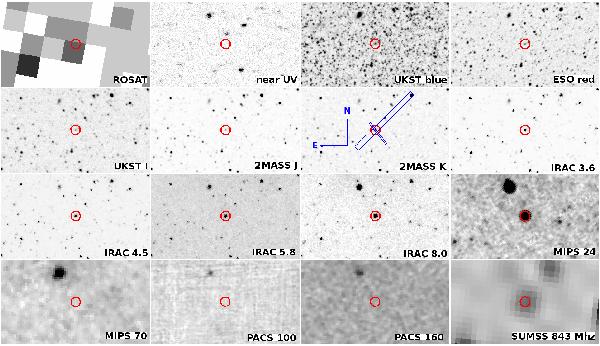
Catalogue of photometric images in increasing wavelength from the X-ray to radio, top left to bottom right. The position of SAGE1CJ053634 is marked by a small circle at the centre of each tile. The image orientation is indicated in the 2MASS Ks panel with arrows of length 1′. The small and the large box in the 2MASS Ks panel indicate the slit position corresponding to the Spitzer/IRS short-low and long-low observations, respectively.
Current usage metrics show cumulative count of Article Views (full-text article views including HTML views, PDF and ePub downloads, according to the available data) and Abstracts Views on Vision4Press platform.
Data correspond to usage on the plateform after 2015. The current usage metrics is available 48-96 hours after online publication and is updated daily on week days.
Initial download of the metrics may take a while.