Free Access
Fig. 6
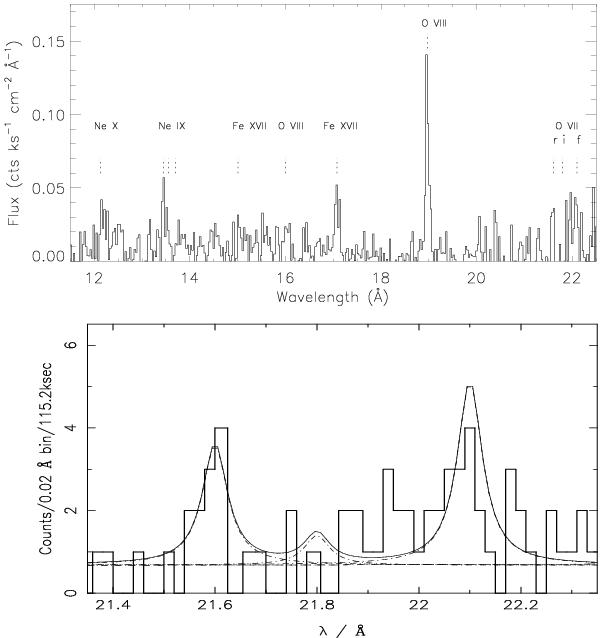
High-resolution X-ray spectrum of IQ Aur. Top: total RGS 1+2 merged and flux-converted. Bottom: O vii triplet with model accounting for effective area inhomogeneities.
This figure is made of several images, please see below:
Current usage metrics show cumulative count of Article Views (full-text article views including HTML views, PDF and ePub downloads, according to the available data) and Abstracts Views on Vision4Press platform.
Data correspond to usage on the plateform after 2015. The current usage metrics is available 48-96 hours after online publication and is updated daily on week days.
Initial download of the metrics may take a while.