Fig. 7
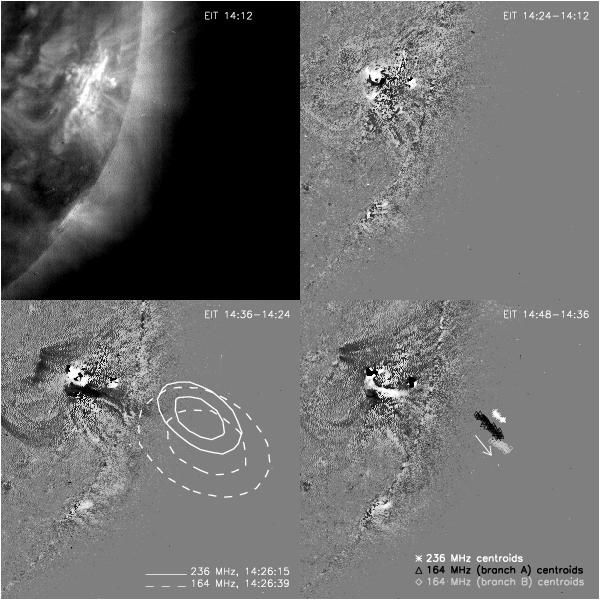
EIT 195 Å and NRH data of the 2000 March 7 event in the same format as in Fig. 3, with the following exceptions: all EIT images except the one of the top-left panel are running difference images. The bottom-left panel shows contour plots of the type II source at 236 and 164 MHz obtained by the NRH at 14:26:15 and 14:26:39 UT, respectively. The right-bottom panel shows the centroids of all NRH sources associated with the type II burst (white stars for 236 MHz, black triangles for 164 MHz sources of branch A, and gray diamonds for 164 MHz sources of branch B).
Current usage metrics show cumulative count of Article Views (full-text article views including HTML views, PDF and ePub downloads, according to the available data) and Abstracts Views on Vision4Press platform.
Data correspond to usage on the plateform after 2015. The current usage metrics is available 48-96 hours after online publication and is updated daily on week days.
Initial download of the metrics may take a while.