Fig. 5
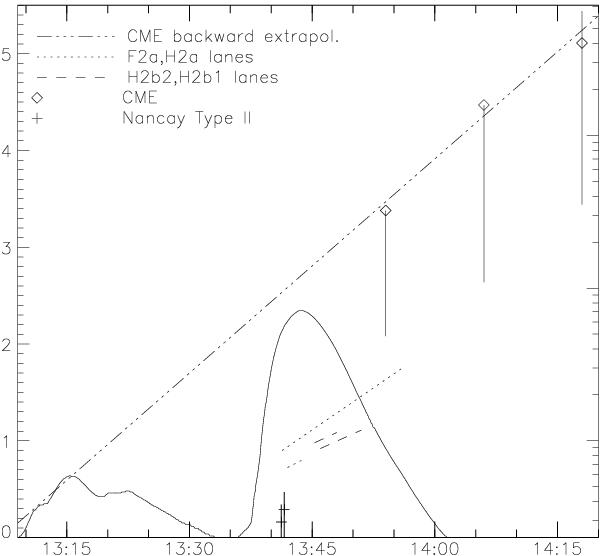
Height-time profiles of the various components of the 2000 March 2 event (the vertical axis shows heights above the photosphere expressed in solar radii). The diamonds denote the heights of the CME front taken from the CME catalog and the crosses denote the heights of the NRH type II sources. The vertical solid lines associated with the diamonds denote the height difference between the outermost and innermost features of the CME front at a given time. The vertical parts of the crosses denote the sizes of the NRH sources. The dashed-dotted curve is the linear fit to the CME heights. The dotted and dashed curves provide the height-time profiles of the F2a-H2a and H2b1-H2b2 lanes, respectively, of the low frequency type II using the 2.8 × Saito density model. The time profile of the GOES X-ray flux in the 1–8 Å channel is also presented.
Current usage metrics show cumulative count of Article Views (full-text article views including HTML views, PDF and ePub downloads, according to the available data) and Abstracts Views on Vision4Press platform.
Data correspond to usage on the plateform after 2015. The current usage metrics is available 48-96 hours after online publication and is updated daily on week days.
Initial download of the metrics may take a while.