Fig. 2
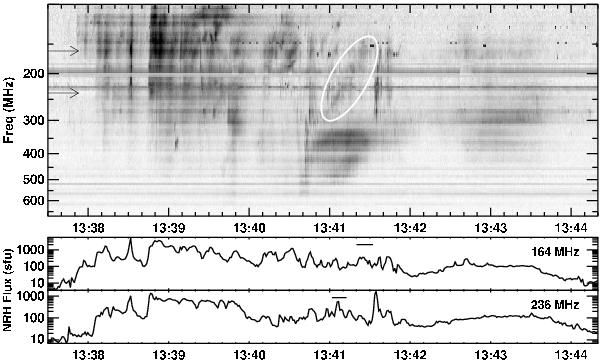
Upper panel: enlarged view of the dynamic spectrum of the 2000 March 2 event observed by ARTEMIS. The type II burst is surrounded by the white ellipse. The arrows indicate the type II frequencies (236 and 164 MHz) observed by the NRH. Lower panel: time profiles of the radio flux at 236 and 164 MHz derived from the NRH maps. The horizontal lines mark the passage of the type II burst.
Current usage metrics show cumulative count of Article Views (full-text article views including HTML views, PDF and ePub downloads, according to the available data) and Abstracts Views on Vision4Press platform.
Data correspond to usage on the plateform after 2015. The current usage metrics is available 48-96 hours after online publication and is updated daily on week days.
Initial download of the metrics may take a while.