Free Access
Fig. 14
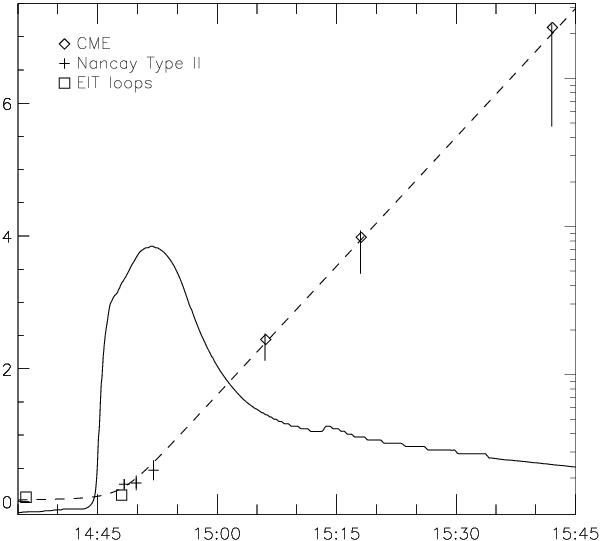
Height-time profiles of various components of the 2000 May 2 event in the same format as in Fig. 5, with the following exceptions. The squares mark the heights of the expanding loops seen in EIT images and the dashed line marks the best fit of the CME heights by the function given in Eq. (2) (see text for details).
Current usage metrics show cumulative count of Article Views (full-text article views including HTML views, PDF and ePub downloads, according to the available data) and Abstracts Views on Vision4Press platform.
Data correspond to usage on the plateform after 2015. The current usage metrics is available 48-96 hours after online publication and is updated daily on week days.
Initial download of the metrics may take a while.