Fig. 12
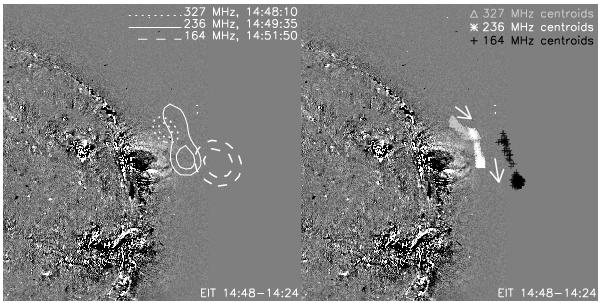
The left panel shows contour plots of the 2000 May 2 type II source at 327, 236, and 164 MHz obtained by the NRH at 14:48:10, 14:49:35, and 14:51:50 UT, respectively (contour levels at 65% and 85% of each frequency’s maximum). The right panel shows the centroids of all NRH sources associated with the type II burst (gray triangles for 327 MHz, white stars for 236 MHz, and black crosses for 164 MHz). The background image is an EIT difference image. The upper arrow denotes the overall direction of motion of the type II source at 327 MHz and the lower arrow denotes the overall direction of motion of the type II source at 236 and 164 MHz.
Current usage metrics show cumulative count of Article Views (full-text article views including HTML views, PDF and ePub downloads, according to the available data) and Abstracts Views on Vision4Press platform.
Data correspond to usage on the plateform after 2015. The current usage metrics is available 48-96 hours after online publication and is updated daily on week days.
Initial download of the metrics may take a while.