Fig. 1
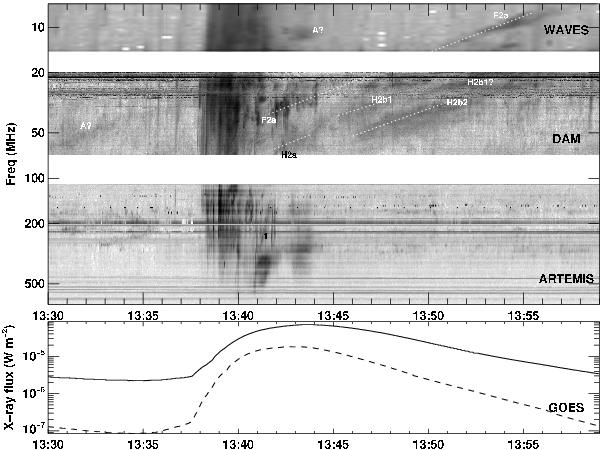
Upper panel: composite dynamic spectrum of the 2000 March 2 event observed between 687 to 7 MHz. From top to bottom, the Wind/WAVES (7–13.825 MHz), Nançay DAM (20–70 MHz), and ARTEMIS data (110–687 MHz) are presented. Lower panel: time profile of the GOES X-ray flux in the 1–8 Å (solid line) and 0.5–4 Å (dashed line) energy channels.
Current usage metrics show cumulative count of Article Views (full-text article views including HTML views, PDF and ePub downloads, according to the available data) and Abstracts Views on Vision4Press platform.
Data correspond to usage on the plateform after 2015. The current usage metrics is available 48-96 hours after online publication and is updated daily on week days.
Initial download of the metrics may take a while.