Fig. 3
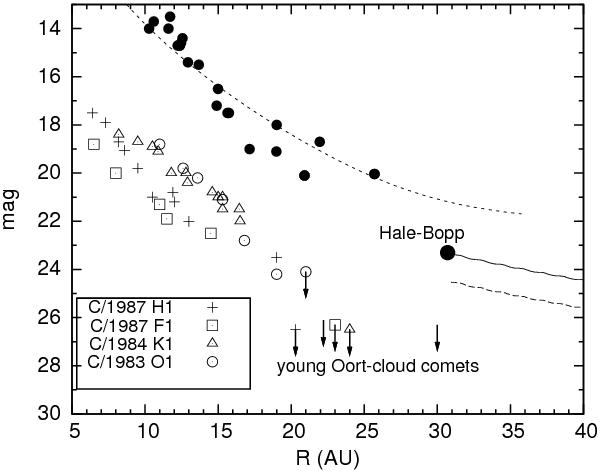
The light curve of Hale-Bopp compared to observations of six dynamically young Oort-cloud comets (Meech et al. 2004; the last five point are upper limits). The top dashed curve shows the prediction of distant activity by Capria et al. (2002). The middle solid curve is the brightness prediction if the nucleus is already dormant. The lower dashed curve plots the expected brightness of a 37 km size nucleus (radius) with 4% albedo (Lamy et al. 2004).
Current usage metrics show cumulative count of Article Views (full-text article views including HTML views, PDF and ePub downloads, according to the available data) and Abstracts Views on Vision4Press platform.
Data correspond to usage on the plateform after 2015. The current usage metrics is available 48-96 hours after online publication and is updated daily on week days.
Initial download of the metrics may take a while.