Fig. 1
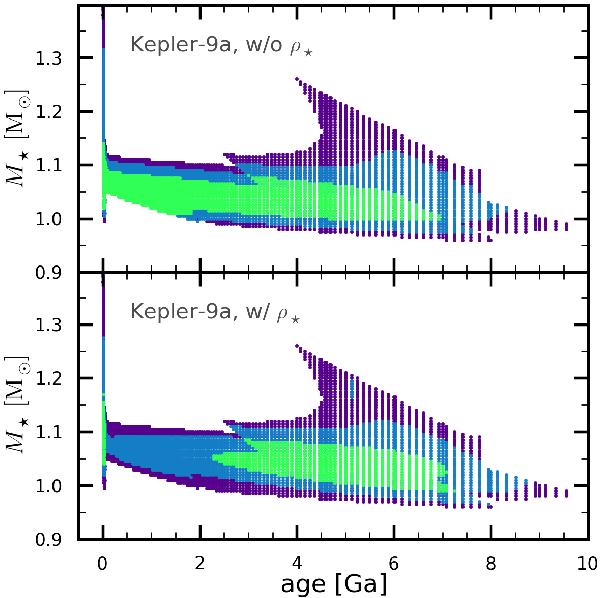
Constraints derived from stellar evolution models on the mass of Kepler-9a as a function of its age. The dots correspond to solutions that fit the input constraints at the 68.3%, 95.4% (blue), and 99.7% levels (purple). The upper panel uses Teff and log g as inputs constraints. The lower panel in addition uses the constraint on the stellar mean density.
Current usage metrics show cumulative count of Article Views (full-text article views including HTML views, PDF and ePub downloads, according to the available data) and Abstracts Views on Vision4Press platform.
Data correspond to usage on the plateform after 2015. The current usage metrics is available 48-96 hours after online publication and is updated daily on week days.
Initial download of the metrics may take a while.