Fig. 8
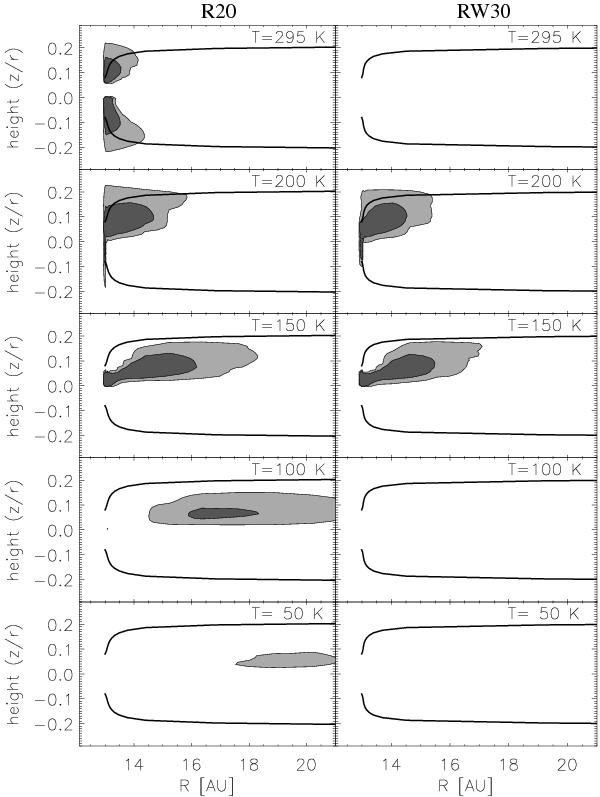
Location of emission of the forsterite 69 μm features, split into its different temperature components for models R20 (left) and RW30 (right). Overplotted is the radial τ = 1 surface in the optical. Contours are given as a fraction of the maximum emission of the total feature, between 1 and 10% (light grey) and 10 and 100% (dark grey). The emission has been integrated over the azimuthal direction.
Current usage metrics show cumulative count of Article Views (full-text article views including HTML views, PDF and ePub downloads, according to the available data) and Abstracts Views on Vision4Press platform.
Data correspond to usage on the plateform after 2015. The current usage metrics is available 48-96 hours after online publication and is updated daily on week days.
Initial download of the metrics may take a while.