Fig. 6
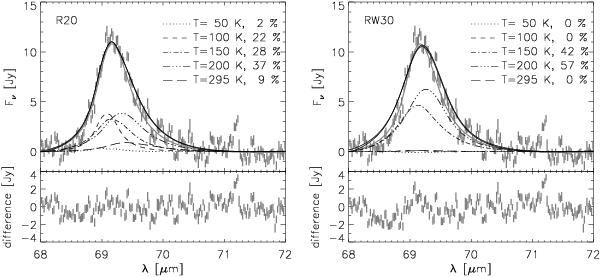
Modelled 69 μm feature shape (solid lines) compare to the PACS observations (grey error bars) for models R20 with a 0.1 μm shift towards longer wavelengths (left) and model RW30 with a 0.05 μm shift (right). Overplotted are the optically thin fit from Sturm et al. (2010) (grey solid line), and contributions from the individual temperature components. The bottom panels show the difference between the PACS observations and the modelled spectra.


Current usage metrics show cumulative count of Article Views (full-text article views including HTML views, PDF and ePub downloads, according to the available data) and Abstracts Views on Vision4Press platform.
Data correspond to usage on the plateform after 2015. The current usage metrics is available 48-96 hours after online publication and is updated daily on week days.
Initial download of the metrics may take a while.