Fig. 5
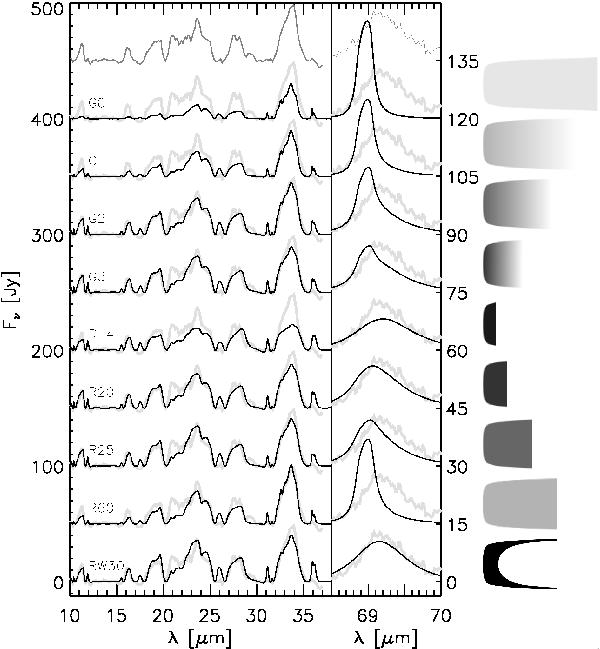
Continuum subtracted spectra comparing the models (solid black) and Spitzer and PACS observations (grey). Presented models have integrated feature strength between 67.5 and 71.0 μm of 8.5 ± 1.5 Jy. Offsets between models are 50 and 15 Jy for the left and right panel respectively. The cartoons on the right show the location of the forsterite in the outer disk, not to scale. A higher intensity represents a higher abundance. Roman symbols present models with: G0 – 2% forsterite throughout the entire disk (gradient with r-0); G1 – gradient with 10% forsterite at 13 AU and r-1; G2 – gradient with 30% forsterite at 13 AU and r-2; G3 – gradient with 40% forsterite at 13 AU and r-3; R14 – ring with 60% forsterite between 13 and 14 AU; R20 – ring with 40% forsterite between 13 and 20 AU; R25 – ring with 30% forsterite between 13 and 25 AU; R60 – ring with 10% forsterite between 13 and 60 AU; RW30 – only 150 and 200 K forsterite, 60% between 13 and 30 AU.


Current usage metrics show cumulative count of Article Views (full-text article views including HTML views, PDF and ePub downloads, according to the available data) and Abstracts Views on Vision4Press platform.
Data correspond to usage on the plateform after 2015. The current usage metrics is available 48-96 hours after online publication and is updated daily on week days.
Initial download of the metrics may take a while.