Fig. 4
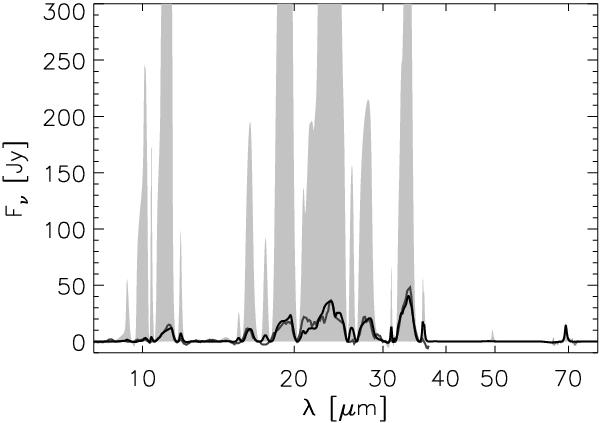
Continuum subtracted spectra comparing the optically thick (solid black) and optically thin (light grey area) approach using only warm forsterite (model RW30). Models are fitted to the 69 μm feature shape. Overplotted are the Spitzer spectrum between 7 and 35 μm and the PACS spectrum between 65 and 73 μm (dark grey lines). A more detailed version comparing the optically thick model and observations can also be found in Fig. 5, panel RW30.
Current usage metrics show cumulative count of Article Views (full-text article views including HTML views, PDF and ePub downloads, according to the available data) and Abstracts Views on Vision4Press platform.
Data correspond to usage on the plateform after 2015. The current usage metrics is available 48-96 hours after online publication and is updated daily on week days.
Initial download of the metrics may take a while.