Fig. 6
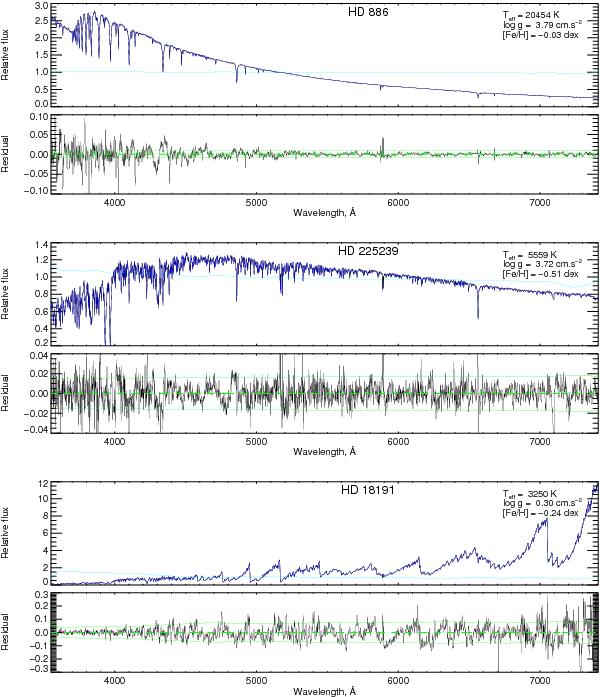
Fits of MILES spectra with the MILES interpolator for three representative stars. For each star, the top panel represents the flux distribution, normalized to an average of one, and the bottom ones the residuals between the observation and the best-fitted interpolated spectrum (observation − model). The fit was performed with ULySS. The continuous green lines are the ± 1σ errors, assuming a constant error spectrum and χ2 = 1. The clear blue lines are the multiplicative polynomials.
Current usage metrics show cumulative count of Article Views (full-text article views including HTML views, PDF and ePub downloads, according to the available data) and Abstracts Views on Vision4Press platform.
Data correspond to usage on the plateform after 2015. The current usage metrics is available 48-96 hours after online publication and is updated daily on week days.
Initial download of the metrics may take a while.