Fig. 3
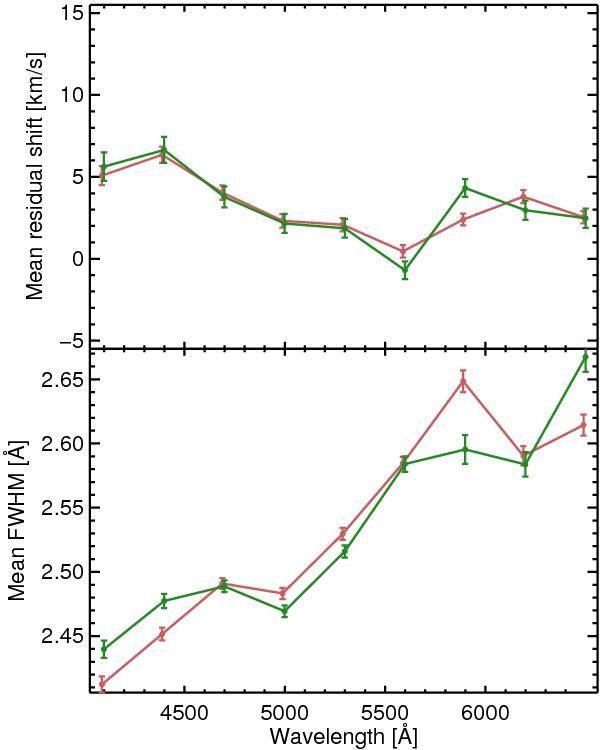
Mean line-spread function of the MILES library, using for reference (i) the interpolated ELODIE spectra (red line and symbols); and (ii) the ELODIE spectra of stars in common (green). The top panel gives the mean residual shift over all the library, and the bottom panel the mean FWHM wavelength resolution. The bars indicate the errors on the mean value (i.e. dispersion/ ). The abscissa of the red symbols are shifted by a small quantity to avoid superposition.
Current usage metrics show cumulative count of Article Views (full-text article views including HTML views, PDF and ePub downloads, according to the available data) and Abstracts Views on Vision4Press platform.
Data correspond to usage on the plateform after 2015. The current usage metrics is available 48-96 hours after online publication and is updated daily on week days.
Initial download of the metrics may take a while.