Fig. 2
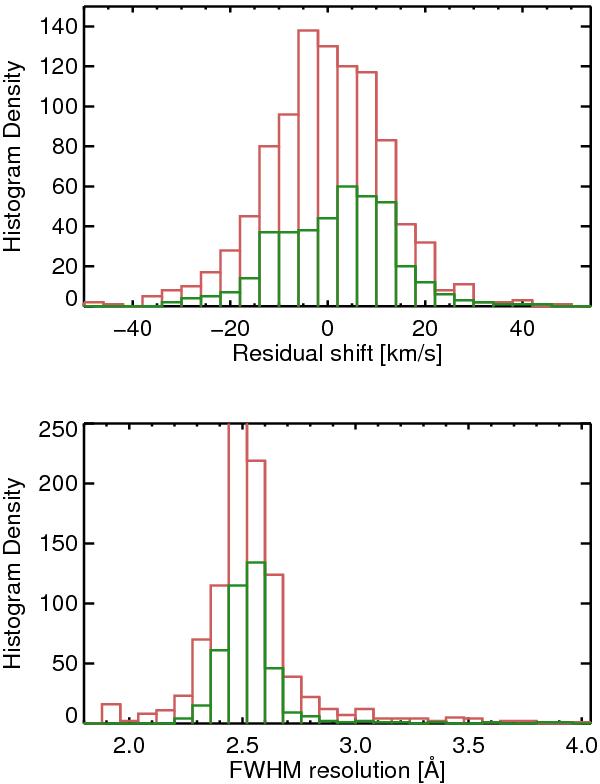
Histograms of the broadening and residual shift of the line-spread function of the MILES library at 5300 Å. The green histograms are for the 404 direct comparisons with spectra of the ELODIE library. The red ones are the comparisons with the ELODIE interpolator. The top panel is the distribution of the residual shifts, in km s-1, and the bottom ones the distribution of the FWHM Gaussian broadening.
Current usage metrics show cumulative count of Article Views (full-text article views including HTML views, PDF and ePub downloads, according to the available data) and Abstracts Views on Vision4Press platform.
Data correspond to usage on the plateform after 2015. The current usage metrics is available 48-96 hours after online publication and is updated daily on week days.
Initial download of the metrics may take a while.