Fig. 2
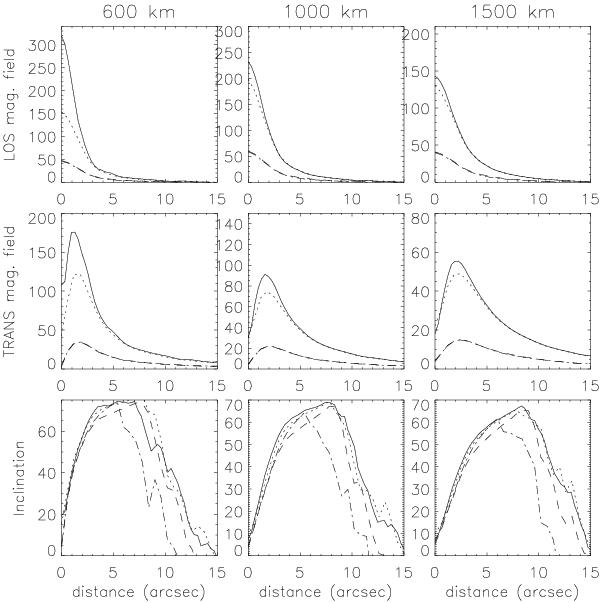
Azimuthally averaged profiles of the LOS and TRANS components and the inclination to the LOS of the extrapolated magnetic field as a function of the distance from a location taken at the center of the network region. The profiles are calculated at 600, 1000, and 1500 km above the photosphere from the MDI average frame (dashed line) and raster (dashed-dotted), SOT/SP in MDI resolution (dotted line) and SOT/SP in full resolution (solid line) magnetograms.
Current usage metrics show cumulative count of Article Views (full-text article views including HTML views, PDF and ePub downloads, according to the available data) and Abstracts Views on Vision4Press platform.
Data correspond to usage on the plateform after 2015. The current usage metrics is available 48-96 hours after online publication and is updated daily on week days.
Initial download of the metrics may take a while.