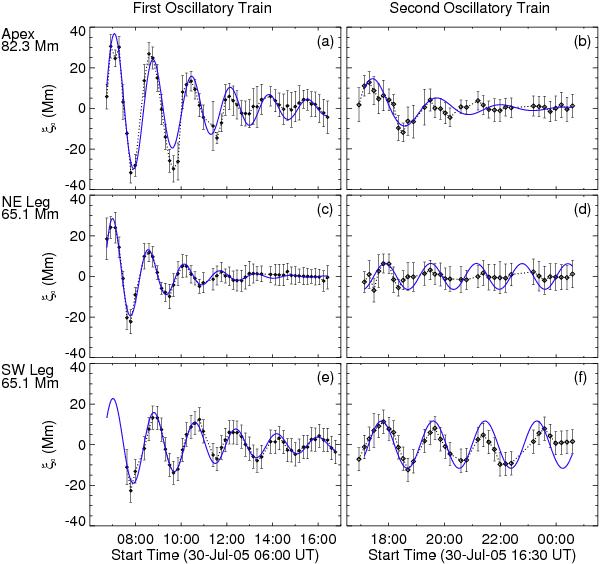
Fig. 5

Examples of fitting to a damped cosine curve. The POS displacements are shown as black diamonds with error bars joined by a dotted line, while the blue line indicates the best fit to Eq. (2) using the mean parameters from a randomisation technique. Upper panels (a), b)): prominence apex at 82.3 Mm. Middle panels (c), d)): NE leg at 65.1. Lower panels (e), f)): SW leg at 65.1 Mm. Left panels (a), c), e)): first oscillatory train. Right panels (b), d), f)): second oscillatory train.
Current usage metrics show cumulative count of Article Views (full-text article views including HTML views, PDF and ePub downloads, according to the available data) and Abstracts Views on Vision4Press platform.
Data correspond to usage on the plateform after 2015. The current usage metrics is available 48-96 hours after online publication and is updated daily on week days.
Initial download of the metrics may take a while.


