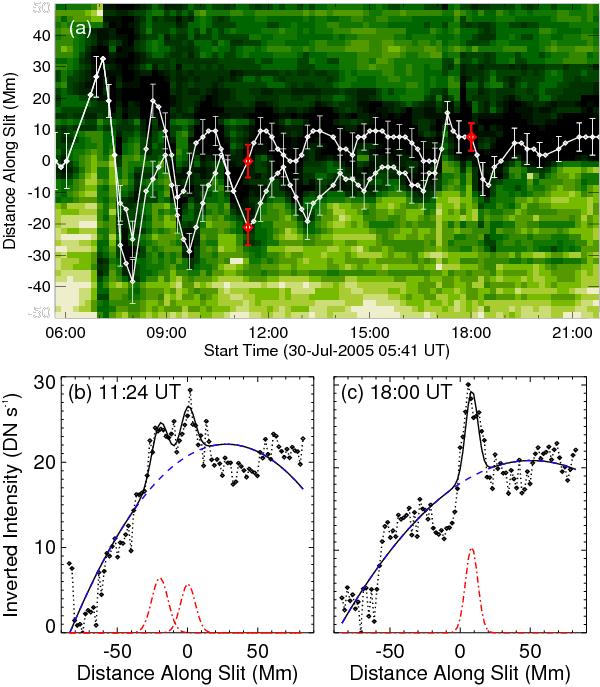
Fig. 4

a) Average 195 Å intensity as a function of horizontal distance and time for the ROI at 76.6 Mm, white diamonds joined by a solid line give the location(s) of the prominence as identified by Gaussian fitting with error bars shown for every second data point, positions at 11:24 and 18:00 UT are in red bold. b) and c) Inverted intensity profiles as a function of horizontal distance, black diamonds joined by a dotted line show the measured intensities, the blue dashed line is the second order polynomial fit to the background, the red dash-dotted lines are Gaussian peaks indicating the prominence location(s), while the solid black line combines these to give the overall fit.
Current usage metrics show cumulative count of Article Views (full-text article views including HTML views, PDF and ePub downloads, according to the available data) and Abstracts Views on Vision4Press platform.
Data correspond to usage on the plateform after 2015. The current usage metrics is available 48-96 hours after online publication and is updated daily on week days.
Initial download of the metrics may take a while.


