Fig. 4
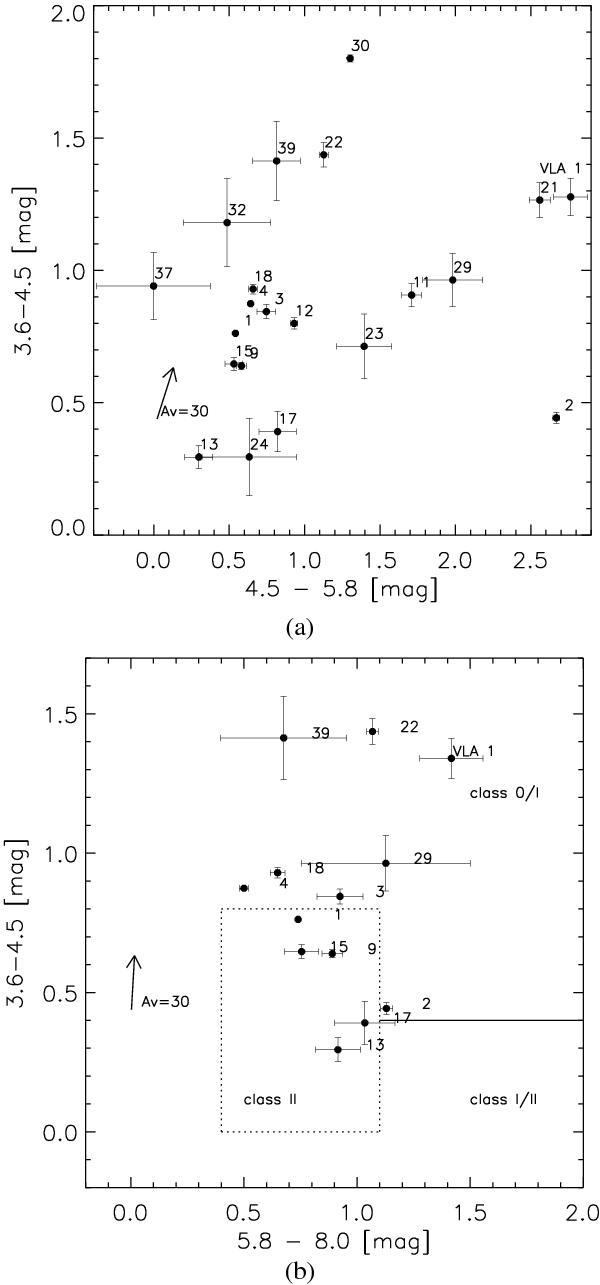
Top: Spitzer/IRAC (3.6–4.5, 4.5–5.8) μm diagram of objects in the SINFONI field centered on IRAS 06084-0611. Photospheric colors from main-sequence stars are usually located around (0, 0). The extinction vector has been calculated using the extinction law of Chiar & Tielens (2006). Bottom: Spitzer (3.6–4.5, 5.8–8.0) μm diagram. We used Allen et al. 2004 and Megeath et al. 2004 to specify the location of class 0/I, class I/II and class II sources (dotted lines).
Current usage metrics show cumulative count of Article Views (full-text article views including HTML views, PDF and ePub downloads, according to the available data) and Abstracts Views on Vision4Press platform.
Data correspond to usage on the plateform after 2015. The current usage metrics is available 48-96 hours after online publication and is updated daily on week days.
Initial download of the metrics may take a while.