Fig. 3
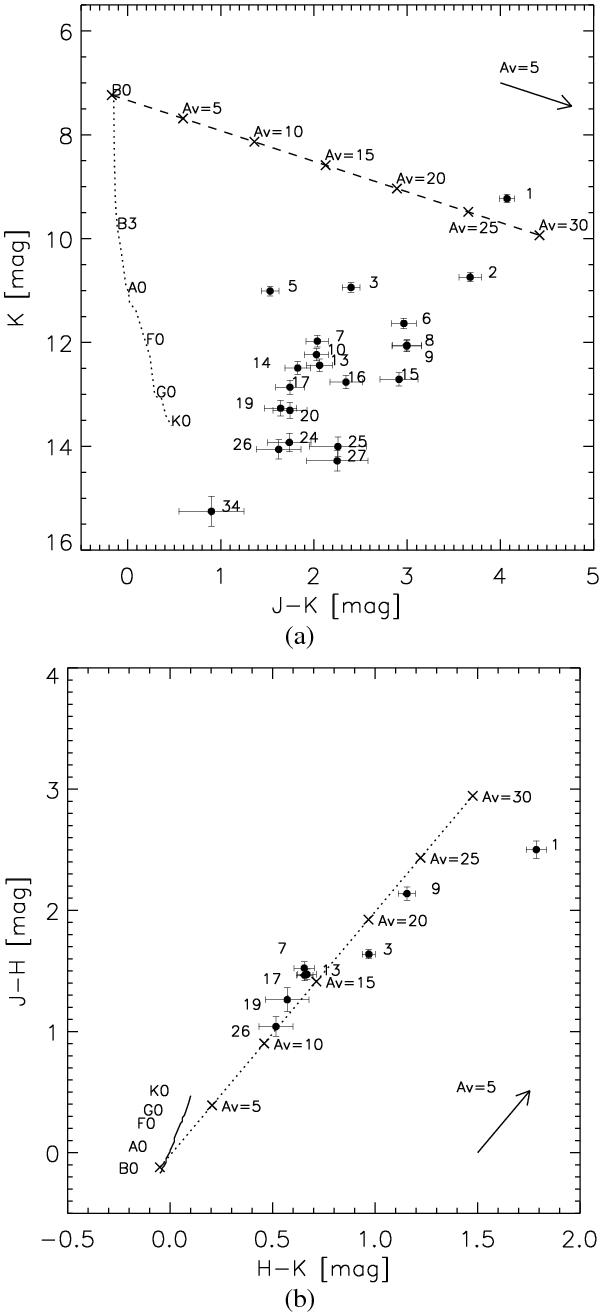
Top: the SOFI (J − K, K) diagram. Bottom: the 2MASS (H − K, J − H) diagram. Both figures only show the detections in the SINFONI field. The visual extinction AV is calculated using the extinction law of Chiar & Tielens (2006). The isochrones of main sequence dwarf stars (Blum et al. 2000; Bessell & Brett 1988) are plotted with an adopted distance for IRAS 06084-0611 of 830 ± 50 pc (Herbst & Racine 1976). Note that narrow-band filters were used with SOFI observations.
Current usage metrics show cumulative count of Article Views (full-text article views including HTML views, PDF and ePub downloads, according to the available data) and Abstracts Views on Vision4Press platform.
Data correspond to usage on the plateform after 2015. The current usage metrics is available 48-96 hours after online publication and is updated daily on week days.
Initial download of the metrics may take a while.