Fig. 10
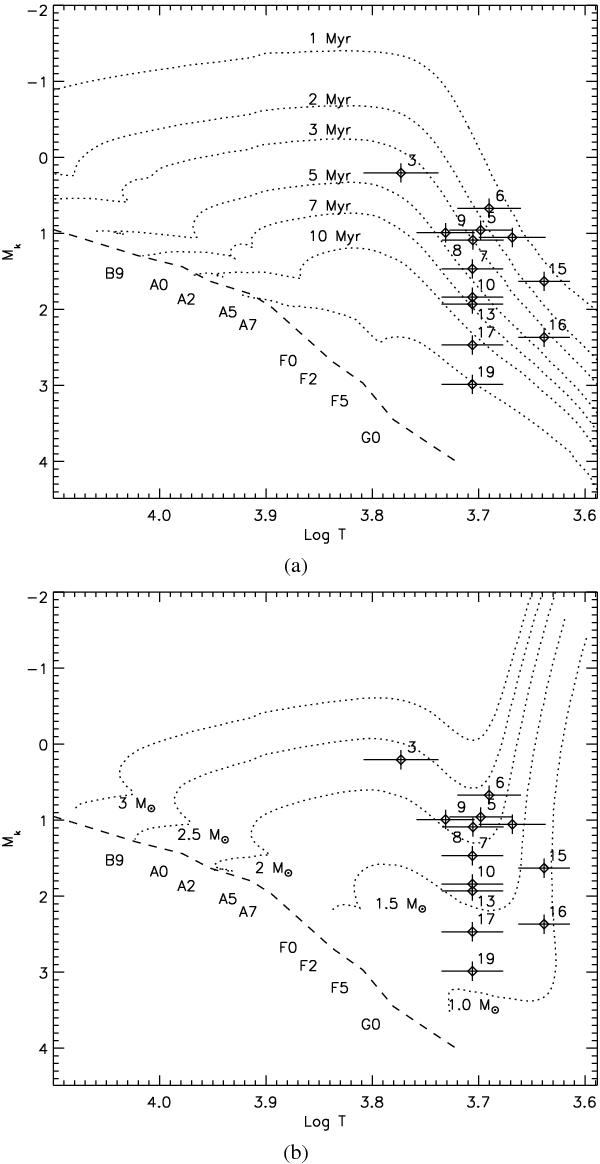
HR diagram of objects classified by their SINFONI spectra. Top: the extinction corrected MK vs. log(T) HR diagram. The K-band magnitude has been corrected for a distance of 830 ± 50 pc. Over plotted with a dashed line is the ZAMS isochrone from Blum et al. (2000) and the dotted lines represent the isochrones from Da Rio et al. (2009) between 1 and 10 Myr calculated from the Siess et al. (2000) evolutionary models. The bottom panel shows the same diagram with overplotted the pre-main-sequence evolutionary tracks for 3, 2.5, 2, 1.5 and 1 M⊙ stars from Da Rio et al. (2009).
Current usage metrics show cumulative count of Article Views (full-text article views including HTML views, PDF and ePub downloads, according to the available data) and Abstracts Views on Vision4Press platform.
Data correspond to usage on the plateform after 2015. The current usage metrics is available 48-96 hours after online publication and is updated daily on week days.
Initial download of the metrics may take a while.