Fig. 1
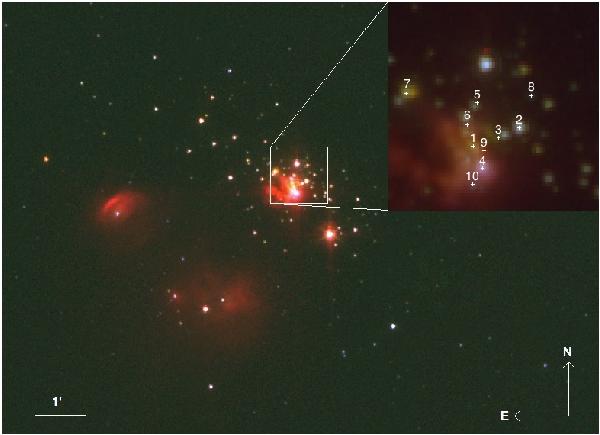
Spitzer/IRAC three-color image of IRAS 06084-0611 and its surroundings (blue: 3.6 μm, green: 4.5 μm, red: 5.8 μm). The dense cluster region delimited by the white box is the area covered by the SINFONI observations. The right upper inlay figure is a close-up of the SINFONI region. The positions of the VLA radio sources and their respective ID numbers (Gómez et al. 2002) are marked with plus signs. Note that VLA 1 represents an H ii region and is also visible in the IRAC bands. The field of view is equal to Fig. 5.
Current usage metrics show cumulative count of Article Views (full-text article views including HTML views, PDF and ePub downloads, according to the available data) and Abstracts Views on Vision4Press platform.
Data correspond to usage on the plateform after 2015. The current usage metrics is available 48-96 hours after online publication and is updated daily on week days.
Initial download of the metrics may take a while.