Fig. 5
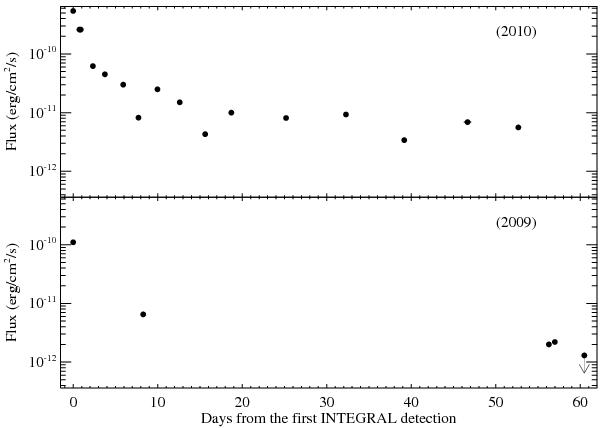
Lightcurves of the outburst decay of IGR J19294+1816 during the two events that occurred in 2009 (lower panel) and 2010 (upper panel). We did not plot the observations carried out in 2007 because in that case the beginning of the outburst was not caught by any X-ray satellite (see Tables 1 and 2). We scaled the values on the X-axis to the first INTEGRAL detection of the source (first point on the left in both panels). This corresponds to 55 497.8877 MJD for the upper panel and 54 917.6184 MJD for the lower panel.
Current usage metrics show cumulative count of Article Views (full-text article views including HTML views, PDF and ePub downloads, according to the available data) and Abstracts Views on Vision4Press platform.
Data correspond to usage on the plateform after 2015. The current usage metrics is available 48-96 hours after online publication and is updated daily on week days.
Initial download of the metrics may take a while.