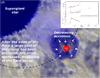
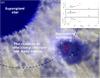
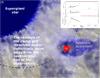
Fig. 17
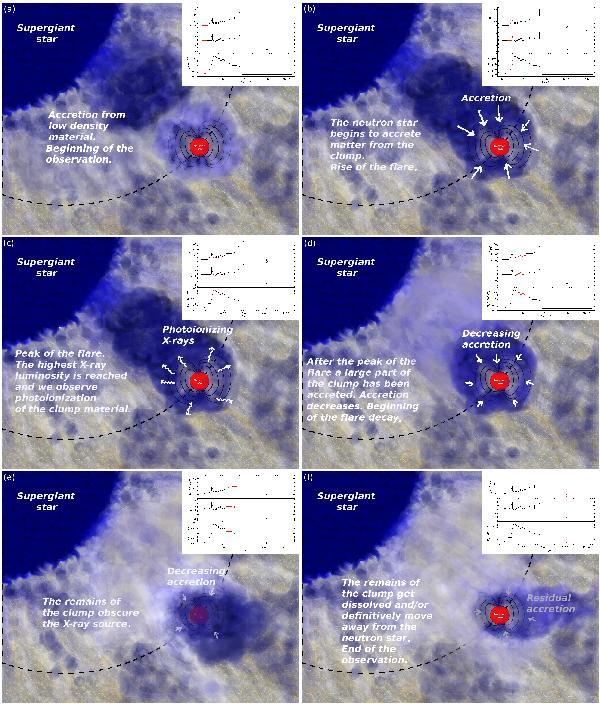
An artist’s view of the “ingestion of a clump” described in Sect. 5.1. Different elements in the figure are not represented to scale. The figures illustrate qualitatively the main phases of the event in chronological order from the top left to the bottom right. In each figure, we plot in the top right corner the XMM-Newton lightcurve of the event already shown in Fig. 7 and highlight with a red color the data points in the plot that correspond to the physical scenario described in the picture. From top left to bottom right: a) at the beginning of the XMM-Newton observation the NS is accreting from a low density material, such that the observed X-ray luminosity is relatively low (~4 × 1032 erg s-1); b) the NS encounters the clump and XMM-Newton observes a rapid rise in the X-ray flux from the source; c) the higher X-ray luminosity (~4 × 1035 erg s-1) causes the photoionization of the surrounding material and a decrease in NH; d) accretion decreases and the source undergoes a rapid decay in the X-ray flux; e) the remains of the clump move in front of the NS along the observer line of sight and obscure the X-ray source; f) the remains of the clump move away and the source returns to its quiescent state (~1032 erg s-1, some residual accretion might still take place).
Current usage metrics show cumulative count of Article Views (full-text article views including HTML views, PDF and ePub downloads, according to the available data) and Abstracts Views on Vision4Press platform.
Data correspond to usage on the plateform after 2015. The current usage metrics is available 48-96 hours after online publication and is updated daily on week days.
Initial download of the metrics may take a while.