Fig. 14
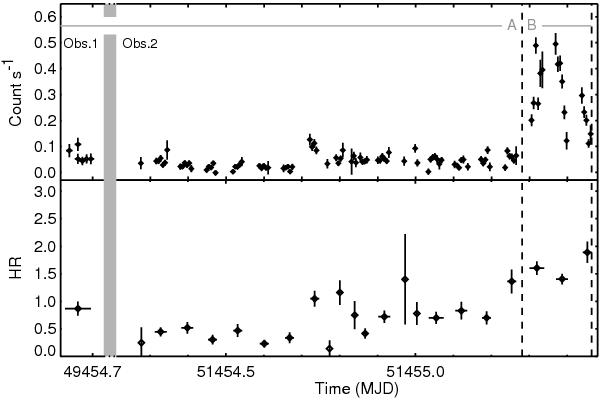
Top panel: ASCA light curve of IGR J18410-0535 in the 0.7–10 keV energy band. Bottom panel: hardness ratio of the 4–10 and 1–4 keV GIS light curves. The vertical dashed lines mark the flare episode starting at MJD 51 455.3. The hashed region marks the separation between Obs. 1 and Obs. 2. A and B denote the two data set selected for the timing analysis.
Current usage metrics show cumulative count of Article Views (full-text article views including HTML views, PDF and ePub downloads, according to the available data) and Abstracts Views on Vision4Press platform.
Data correspond to usage on the plateform after 2015. The current usage metrics is available 48-96 hours after online publication and is updated daily on week days.
Initial download of the metrics may take a while.