Fig. 13
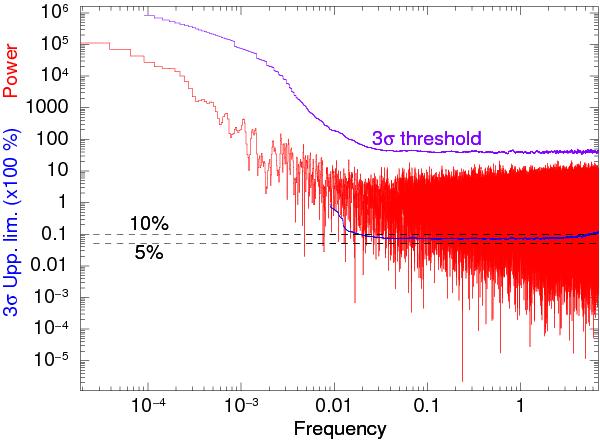
Power spectrum produced using data from the entire XMM-Newton observations (0.3–12 keV). The upper continuous line represents the power threshold for detection of periodicity at a 3σ c.l., according to the method described by Israel & Stella (1996). We also show in the bottom part of the plot a second continuous curve that represents the upper limit calculated with the same method, on the presence of pulsations from IGR J18410-0535 as a function of the frequency. The two dashed lines represent the 5% and 10% upper limit levels on that curve. The most stringent upper limit we could provide with this method is 6–10% for frequencies in the range 0.02–6.8 Hz.
Current usage metrics show cumulative count of Article Views (full-text article views including HTML views, PDF and ePub downloads, according to the available data) and Abstracts Views on Vision4Press platform.
Data correspond to usage on the plateform after 2015. The current usage metrics is available 48-96 hours after online publication and is updated daily on week days.
Initial download of the metrics may take a while.