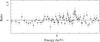
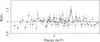
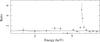
Fig. 11
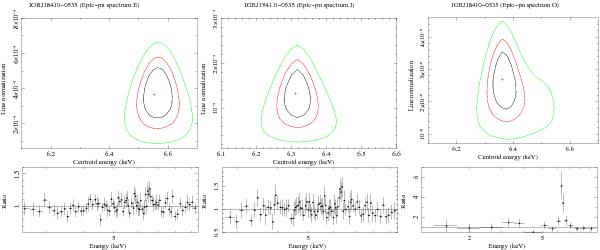
Top panels: contour plots of the iron line centroid energy vs. normalization measured from the spectrum E (left), I (middle), and O (right). The contours correspond to the 68%, 90%, and 99% c.l. There is a marginal indication of a change in the centroid energy of the line between the time interval E and the other two. Bottom panels: the ratio of the data to the model of the spectra extracted during the time interval E (left), I (middle), and O (right). All these spectra were fit by using only an absorbed power-law model in order to highlight the presence of the iron line in the residuals from the fit.
Current usage metrics show cumulative count of Article Views (full-text article views including HTML views, PDF and ePub downloads, according to the available data) and Abstracts Views on Vision4Press platform.
Data correspond to usage on the plateform after 2015. The current usage metrics is available 48-96 hours after online publication and is updated daily on week days.
Initial download of the metrics may take a while.