Fig. 4
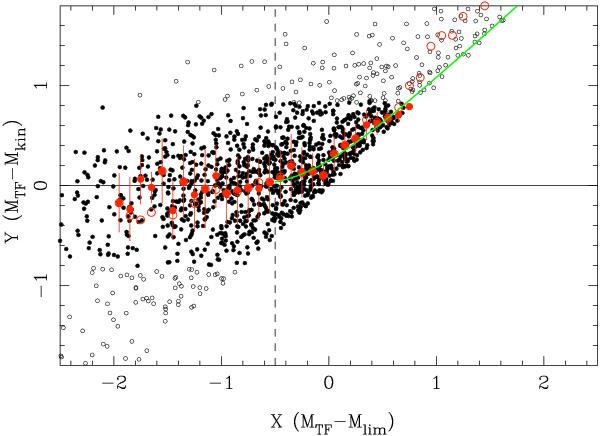
TFR residuals (Y = MTF − Mkin) against the normalized distance modulus (X) for the calibration sample. Small open circles represent the entire sample galaxies, and larger open circles show the average values of Y in 0.1 mag. step. Black filled circles are galaxies kept after the removal of outliers in the TFR plot. Larger filled circles with error bars show the average values for them. The vertical dashed line at X = −0.5 indicates the upper limit of “bias-free” region. The thick green line shows the analytical curve giving the expected ⟨ Y ⟩ computed from the dispersion of our IRTFR. See text for details.
Current usage metrics show cumulative count of Article Views (full-text article views including HTML views, PDF and ePub downloads, according to the available data) and Abstracts Views on Vision4Press platform.
Data correspond to usage on the plateform after 2015. The current usage metrics is available 48-96 hours after online publication and is updated daily on week days.
Initial download of the metrics may take a while.