Fig. 4
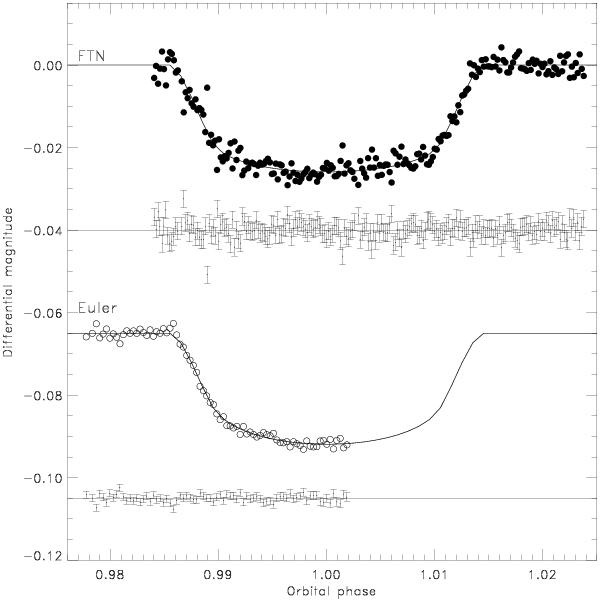
FTN z-band and Euler r-band follow-up high signal-to-noise photometry of WASP-39b during the transit. The Euler light curve has been ofsetted from zero by an arbitrary amount for clarity. The data are phase-folded on the ephemeris from Table 4. Superposed (black-solid line) is the best-fit transit model estimated using the formalism from Mandel & Agol (2002). Residuals from the fit are displayed underneath.
Current usage metrics show cumulative count of Article Views (full-text article views including HTML views, PDF and ePub downloads, according to the available data) and Abstracts Views on Vision4Press platform.
Data correspond to usage on the plateform after 2015. The current usage metrics is available 48-96 hours after online publication and is updated daily on week days.
Initial download of the metrics may take a while.