Fig. 8
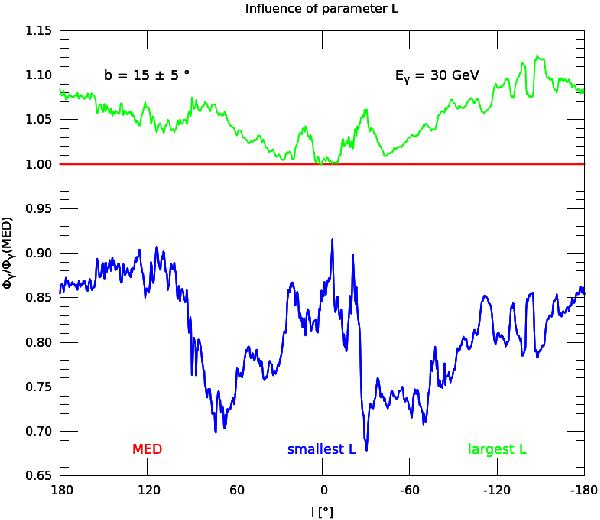
The half thickness L of the DH was varied with respect to the Med configuration while keeping all the other parameters fixed. The green and blue curves correspond to the largest (15 kpc) and smallest (1 kpc) values of L, respectively. The red axis stands for the reference case (4 kpc). The variations in the γ-ray diffuse emission are drastic.
Current usage metrics show cumulative count of Article Views (full-text article views including HTML views, PDF and ePub downloads, according to the available data) and Abstracts Views on Vision4Press platform.
Data correspond to usage on the plateform after 2015. The current usage metrics is available 48-96 hours after online publication and is updated daily on week days.
Initial download of the metrics may take a while.