Fig. 6
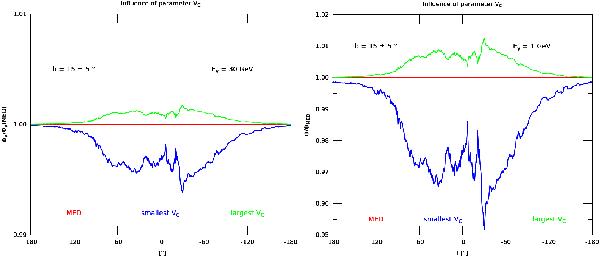
Same as in Fig. 5 but varying the convective wind velocity VC instead of the normalization K0 or the spectral index δ of the space diffusion coefficient. The blue and green curves correspond to the lowest (5 km s-1) and highest (14 km s-1) values of VC respectively. While fairly small at 30 GeV (left panel), the effect increases at 1 GeV (right panel).
Current usage metrics show cumulative count of Article Views (full-text article views including HTML views, PDF and ePub downloads, according to the available data) and Abstracts Views on Vision4Press platform.
Data correspond to usage on the plateform after 2015. The current usage metrics is available 48-96 hours after online publication and is updated daily on week days.
Initial download of the metrics may take a while.