Fig. 15
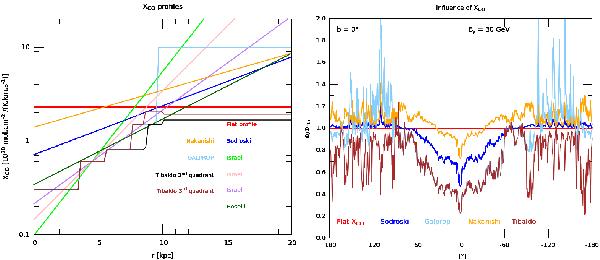
The various XCO Galactic radial profiles available in the literature are displayed in the left panel. The corresponding variations in the γ-ray flux at 30 GeV and b = 0° are displayed relative to our reference model of Fig. 1 for which the constant value of 2.3 × 10²⁰ molecules cm-2 (K km s-1)-1 has been assumed for XCO. The three (cyan) peaks, whose maxima have not been displayed for clarity, reach a value of 3.0, 2.3, and 2.3 respectively from left to right.
Current usage metrics show cumulative count of Article Views (full-text article views including HTML views, PDF and ePub downloads, according to the available data) and Abstracts Views on Vision4Press platform.
Data correspond to usage on the plateform after 2015. The current usage metrics is available 48-96 hours after online publication and is updated daily on week days.
Initial download of the metrics may take a while.