Fig. 4
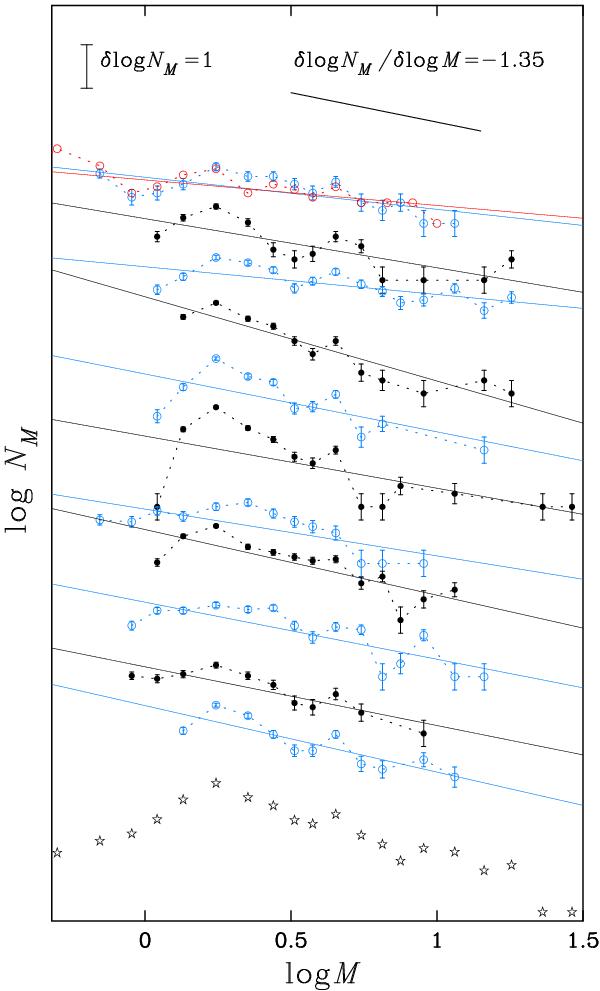
Mass functions for all clusters with PMS member stars obtained from S00 models. The sequence of mass functions follows the order in Table 1 (ascending Galactic longitude). The size of the scale in the vertical axis and the Salpeter slope (− 1.35) are shown in the upper part of the plot. For NGC 2362, the number of members with X-ray activity, Hα emission, and Li6707 Å absorption are plotted as red circles for comparison. The joint mass function obtained by adding the member numbers of all clusters in each mass bin is plotted at the bottom as stars.
Current usage metrics show cumulative count of Article Views (full-text article views including HTML views, PDF and ePub downloads, according to the available data) and Abstracts Views on Vision4Press platform.
Data correspond to usage on the plateform after 2015. The current usage metrics is available 48-96 hours after online publication and is updated daily on week days.
Initial download of the metrics may take a while.