Free Access
Fig. 15
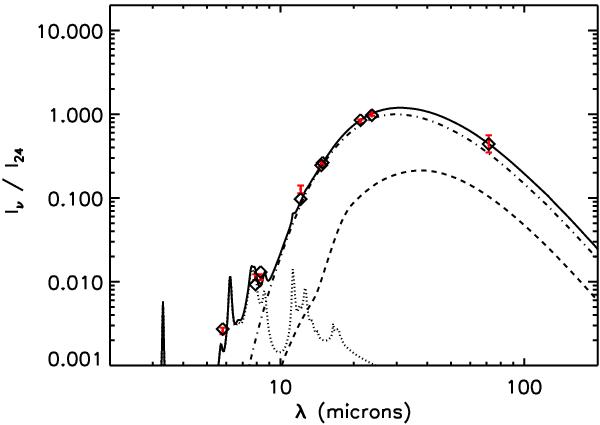
Same as Fig. 14d but with χ/χ0 = 2 and a free mean size of the VSG component. The solid line is the total model spectrum, the dotted line, the dash-dotted line and the dashed line represent, respectively, the PAH, the VSG, and the BG contributions. Diamonds are model broadband fluxes. Red crosses are measurements.
Current usage metrics show cumulative count of Article Views (full-text article views including HTML views, PDF and ePub downloads, according to the available data) and Abstracts Views on Vision4Press platform.
Data correspond to usage on the plateform after 2015. The current usage metrics is available 48-96 hours after online publication and is updated daily on week days.
Initial download of the metrics may take a while.