Fig. 13
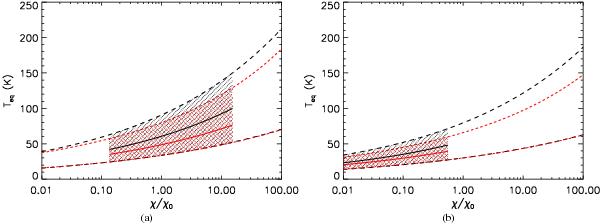
BG equilibrium temperature as a function of the radiation field intensity. The hatched area corresponds to the range of equilibrium temperatures span by the entire BGs size distribution. The solid lines represent the equilibrium temperature for the most abundant size bin. The hatched area and the solid line are only plotted for the values of χ/χ0 that are given by Fig. 12. Black is for LamC grains, red is for aSil grains as described in Compiègne et al. (2011). The radiation field spectral shape is that mention in the text with a) no extinction, b) A(FUV) = 1 mag and the Lyman continuum photons removed.
Current usage metrics show cumulative count of Article Views (full-text article views including HTML views, PDF and ePub downloads, according to the available data) and Abstracts Views on Vision4Press platform.
Data correspond to usage on the plateform after 2015. The current usage metrics is available 48-96 hours after online publication and is updated daily on week days.
Initial download of the metrics may take a while.