Fig. 8
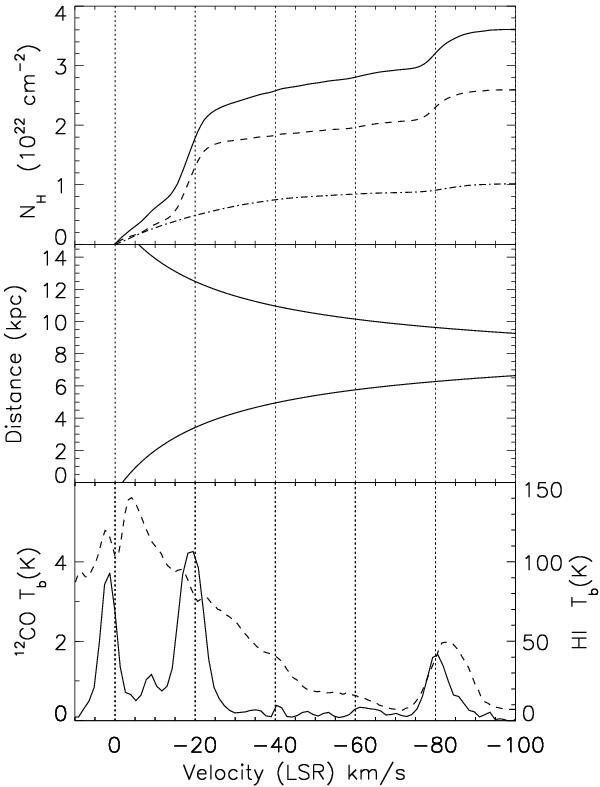
Top: cumulative absorbing column density (solid line) as a function of radial velocity at the position of highest X-ray absorption (see Sect. 4.3). The relative contributions from the atomic and molecular hydrogen are represented by the dashed and dash-dotted lines respectively. Middle: rotation curve towards the same direction as derived from the model of Galactic rotation of Hou et al. (2009). Bottom: 12CO (dashed line) and HI (dash-dotted line) spectra obtained the region highest X-ray absorption.
Current usage metrics show cumulative count of Article Views (full-text article views including HTML views, PDF and ePub downloads, according to the available data) and Abstracts Views on Vision4Press platform.
Data correspond to usage on the plateform after 2015. The current usage metrics is available 48-96 hours after online publication and is updated daily on week days.
Initial download of the metrics may take a while.