Fig. 7
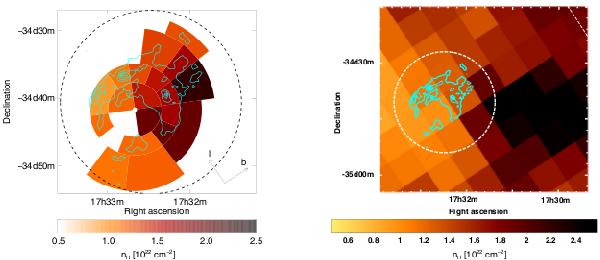
Left: X-ray absorption map derived from a spectral fit to XMM-Newton data assuming an absorbed power-law model. A significant increase of NH towards the Galactic plane is observed.Right: absorption column map derived from atomic and molecular hydrogen when integrating over radial velocities from 0 km s-1 to −25 km s-1 (see Sect. 4.3 for more details). The Galactic plane is represented by the white dashed line. In both panels, the XMM-Newton field of view is represented by a dashed circle and the X-ray contours obtained from Fig. 5 (center) are overlaid.
Current usage metrics show cumulative count of Article Views (full-text article views including HTML views, PDF and ePub downloads, according to the available data) and Abstracts Views on Vision4Press platform.
Data correspond to usage on the plateform after 2015. The current usage metrics is available 48-96 hours after online publication and is updated daily on week days.
Initial download of the metrics may take a while.